August 14, 2026
Amenity Investment Returns: Real Examples and Formulas
Discover real examples of amenity investments that maximize returns, including WiFi and package lockers, and learn how they boost revenue.

The amenity investments that pay back fastest are connectivity infrastructure, package locker systems, and revenue-generating profit centers. Property-wide WiFi at The Haven at Chisholm Trail (Fort Worth, TX) generated $36.89 per door per month across 328 units, roughly $145,200 annually, and the sponsor reported a ~32% cash-on-cash return compared with 8–12% for typical cosmetic renovations. Package locker systems like Luxer One® from Locker Solutions add ancillary fee revenue per door while cutting staff time, often paying back within 18–36 months on a mid-size community. These amenity investment return examples share three drivers:
- Rent premium capture: residents pay more per month for a unit with the amenity than a comparable unit without it.
- Ancillary fees: the amenity generates a direct revenue line (WiFi subscriptions, locker fees, booking charges) separate from base rent.
- Retained NOI from lower turnover: keeping a resident costs far less than replacing one, and amenities measurably lift renewal rates.
The math below shows you exactly how to model each driver, with copy-pasteable formulas and worked U.S. examples you can drop into a spreadsheet today.
Key Takeaways
Amenity investments with a direct revenue line (WiFi subscriptions, locker fees, bookable spaces) consistently outperform pure cost-center amenities because they add NOI that compounds into exit value through cap rate math.
| Point | Details |
|---|---|
| Connectivity leads on CoC | Property-wide WiFi at The Haven at Chisholm Trail returned ~32% CoC, versus 8–12% for cosmetic renovations. |
| Unit count drives feasibility | The same amenity that produces a high IRR on 250 units can produce a negative NPV on 60 units. |
| NOI uplift multiplies at exit | Every $14,655 in annual NOI added translates to roughly $266,455 in property value at a 5.5% cap rate. |
| Downside-test before approving | Model at 30–50% adoption; if NPV is still positive, the investment has a real margin of safety. |
| Locker Solutions package lockers | Quoted per property |
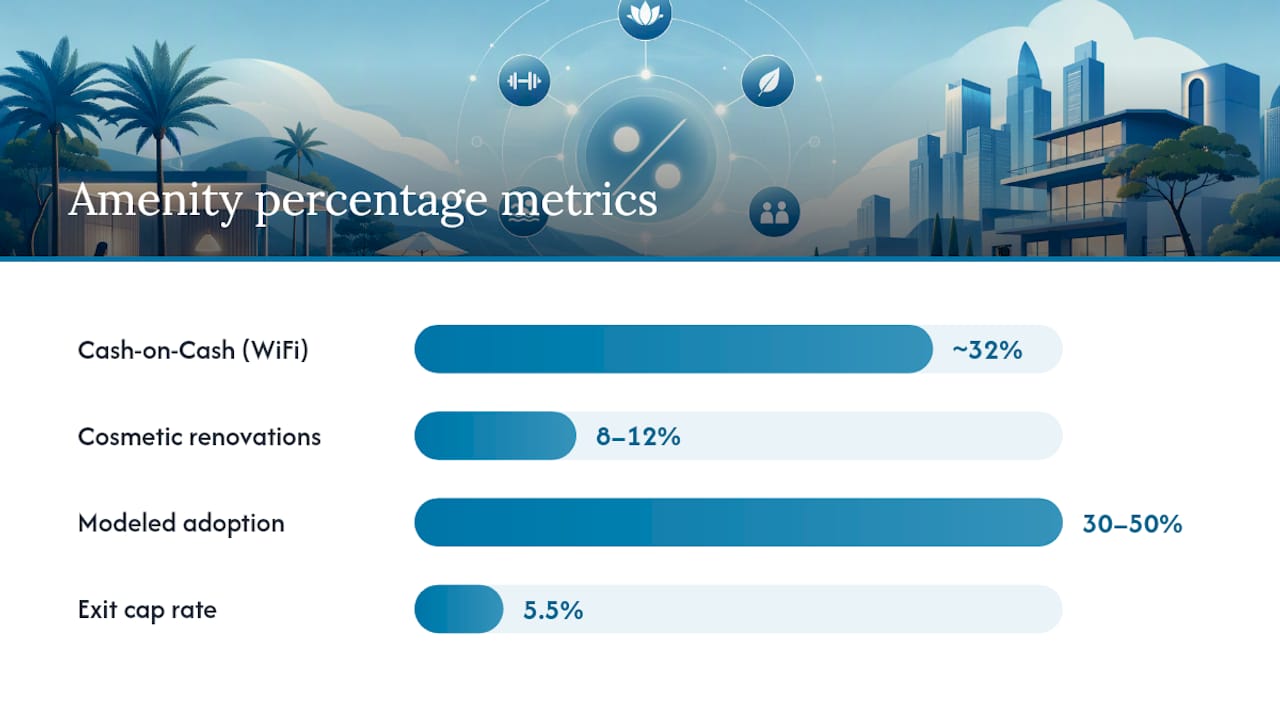
Table of Contents
- How to calculate amenity investment returns: core formulas and worked examples
- Which metrics do you need to measure before and after installing an amenity?
- Worked examples: four US-based amenity ROI case studies
- How an NOI increase from amenities converts into property value
- Typical costs, operating budgets, and payback timelines by amenity type
- A practical checklist for deciding whether to greenlight an amenity investment
- A spreadsheet-ready model you can paste into Excel or Google Sheets
- What asset managers actually do with amenity ROI models
- Package lockers from Locker Solutions: a concrete ROI example
- Sources
How to calculate amenity investment returns: core formulas and worked examples
These five formulas cover every calculation you will need. Each one is paired with a short numeric example so you can see the inputs in action.
Simple ROI
Formula: ROI = (Annual Net Benefit ÷ Total Capital Cost) × 100
It generates $8,400/year in resident fees and saves $6,000/year in staff time (converted to NOI). Net benefit = $14,400.
Cash-on-cash return (CoC)
Formula: CoC = Annual Pre-Tax Cash Flow ÷ Total Equity Invested × 100
Annual cash flow = $14,400 net benefit minus $7,128 debt service = $7,272. Leverage amplifies CoC significantly on low-capital amenity installs. Unlevered CoC uses total capital cost in the denominator instead.
Simple payback period
Formula: Payback = Total Capital Cost ÷ Annual Net Benefit
For amenities with higher upfront costs and lower annual returns (pools, full fitness buildouts), payback can stretch to 7–10 years.
NPV and IRR
NPV discounts all future cash flows back to today. A positive NPV means the investment creates value above your hurdle rate. IRR is the discount rate that makes NPV equal zero. Use IRR when comparing amenity projects of different sizes or hold periods. The academic analysis of Class A amenity packages found unlevered IRRs up to 84% under favorable assumptions, though those figures depend heavily on unit count and captured rent premium.
Value uplift via cap rate
Formula: Property Value Uplift = Annual NOI Uplift ÷ Cap Rate
This is the number that matters most to owners planning a sale.
Pro Tip: *The most common modeling mistake is applying the full market rent premium to every unit. In practice, you capture the premium only on new leases and renewals where the amenity was a decision factor.
Which metrics do you need to measure before and after installing an amenity?
Good data before installation is what separates a defensible pro forma from a guess. Collect these inputs across a 6–12 month baseline period before any amenity goes live, then track the same metrics for 12 months post-installation.
Primary metrics to track:
- Rent premium per unit (concession-adjusted, not gross asking rent)
- Occupancy rate (monthly, not just at lease-up)
- Lease renewal rate (percentage of expiring leases that renew)
- Turnover cost per unit (make-ready, leasing commission, vacancy loss)
- Ancillary revenue per unit per month (fees, subscriptions, booking charges)
- Incremental operating expense (maintenance, management, utilities added by the amenity)
- Utilization rate (percentage of residents actively using the amenity each month)
The amenity ROI calculator framework used by most operators converges on exactly these inputs, which means a spreadsheet built around them is portable across property types.
Data collection checklist:
- Set a minimum 6-month baseline; 12 months is better for seasonal amenities like pools.
- Build a comparable set of 3–5 similar properties in the submarket without the amenity.
- Measure rent premium against the comparable set, not against your own pre-renovation rents.
- Run a resident survey at 30 and 90 days post-launch to capture adoption rates and willingness to pay.
- Track staff time saved weekly for the first 90 days and convert to an hourly dollar figure.
If you are missing baseline data, use submarket averages from CoStar or your property management system. A rough estimate is better than leaving the cell blank, provided you label it clearly as an assumption.
Worked examples: four US-based amenity ROI case studies
Case A: Property-wide WiFi as a revenue amenity
The Haven at Chisholm Trail, Fort Worth, TX (328 units)
The sponsor installed property-wide WiFi as a one-time capital investment and structured it as a paid resident service rather than a bundled amenity. Revenue came to $36.89 per door per month, totaling approximately $145,200/year.
Step math:
- Annual revenue: 328 units × $36.89/month × 12 = $145,200
- Assume infrastructure cost of ~$454,000 (back-calculated from 32% CoC: $145,200 ÷ 0.32)
- NOI uplift: $145,200/year (assuming minimal incremental OPEX after install)
- Value uplift at 5.5% cap rate: $145,200 ÷ 0.055 = $2.64M (consistent with the reported $2.6M added at exit)
Sensitivity notes:
- If adoption drops 50% (only 164 units subscribe), annual revenue falls to ~$72,600 and CoC drops to ~16%. Still above cosmetic renovation benchmarks.
- If the ISP raises wholesale costs by $10/door/month, net revenue drops ~$39,360/year and value uplift shrinks by ~$716,000 at the same cap rate.
- Infrastructure plays like fiber are harder to replicate quickly than cosmetic upgrades, which gives this type of amenity a competitive durability advantage.
Case B: Package locker system on a 150-unit community
Assumptions: Luxer One® indoor locker system installed across a 150-unit property. Annual OPEX (maintenance, software): $2,400. Staff time saved: 1.5 hours/day × $18/hour × 365 days = $9,855/year.
Step math:
- Annual fee revenue: 120 units × $5 × 12 = $7,200
- Staff savings: $9,855
- Total annual benefit: $17,055
- Less OPEX: $17,055 – $2,400 = $14,655 net NOI uplift
- Value uplift at 5.5% cap rate: $14,655 ÷ 0.055 = $266,455
Sensitivity notes:
- At 50% adoption (75 units paying fees), fee revenue drops to $4,500. Net NOI = $11,955. Payback extends to 3.2 years. CoC falls to 31.5%. Still a strong return.
- If staff savings are excluded (e.g., property already uses a third-party service), net NOI = $4,800. Payback = 7.9 years. The locker fee alone barely justifies the install on a small property, which is why staff-time conversion matters.
Pro Tip: Use the package locker cost calculator to get a capital cost estimate specific to your unit count before finalizing your pro forma.
Case C: Reservable private spaces as a profit center
Operators are increasingly treating bookable amenity spaces as standalone revenue lines rather than bundled overhead. A conference room or private dining space that costs $25,000 to build out can generate booking revenue if priced and marketed correctly.
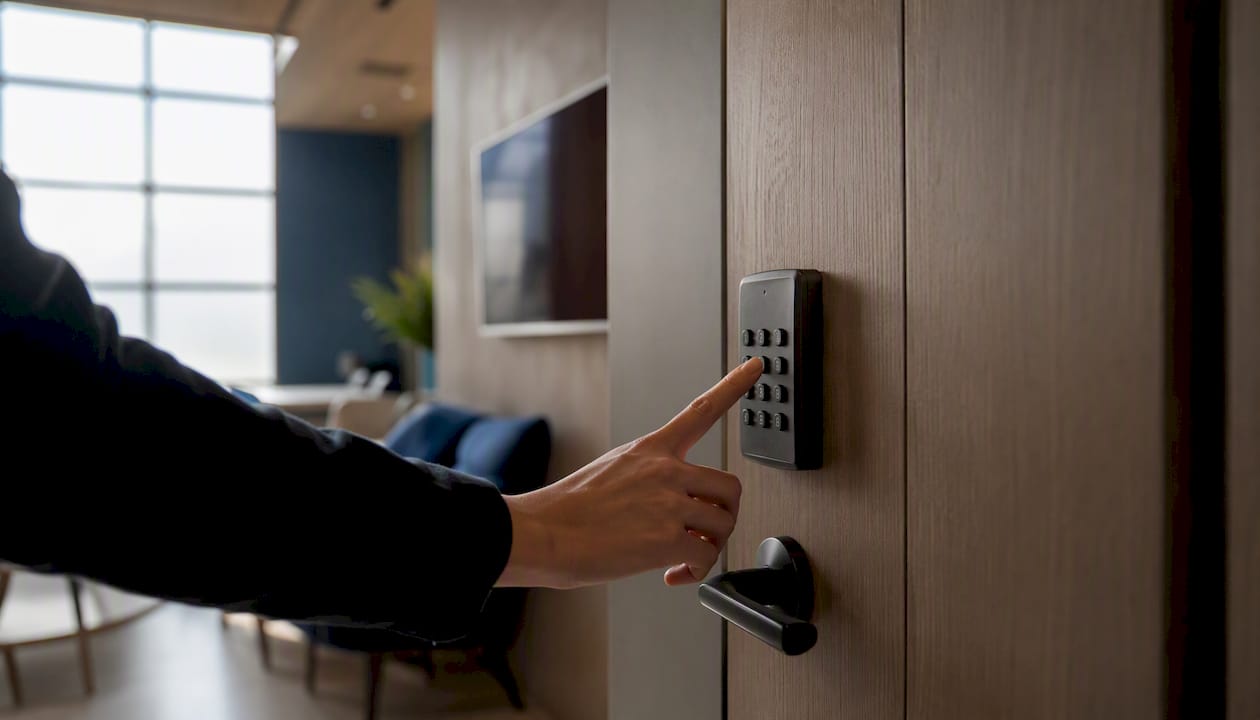
Assumptions: 200-unit property. Private event room, $25,000 buildout. Booking fee: $75/event. Annual OPEX (cleaning, supplies, software): $3,600.
Step math:
- Annual booking revenue: 94 × $75 = $7,050
- Less OPEX: $7,050 – $3,600 = $3,450 net NOI uplift
- Simple payback: $25,000 ÷ $3,450 = 7.2 years
- CoC (unlevered): $3,450 ÷ $25,000 = 13.8%
- Value uplift at 5.5% cap rate: $3,450 ÷ 0.055 = $62,727
This is a modest direct return. The stronger case for bookable spaces is indirect: they lift renewal rates and support a rent premium on adjacent units.
Case D: A cautionary example (luxury pool on a small property)
A 60-unit garden-style community installs a resort-style pool for $180,000. Annual OPEX (chemicals, lifeguard, insurance, maintenance): $28,000.
Step math:
- Annual rent premium revenue: 42 × $40 × 12 = $20,160
- Less OPEX: $20,160 – $28,000 = –$7,840 net NOI impact (negative)
- NPV at 10% discount rate over 10 years: deeply negative. The amenity destroys value at this scale.
The academic sensitivity analysis confirms this pattern: the same amenity specification that produces a high IRR on a 250-unit building can produce a negative NPV on a 60-unit property. Unit count is the most underappreciated variable in amenity underwriting.
How an NOI increase from amenities converts into property value
The conversion is straightforward: Property Value Uplift = Annual NOI Uplift ÷ Cap Rate. Every dollar of annual NOI you add is worth a multiple at sale, and that multiple is determined by the cap rate buyers apply to your asset class and submarket.
A $20,000/year NOI increase looks very different depending on where cap rates sit:
Use the cap rate your broker or appraiser applies to comparable sales in your submarket, not a national average. For sensitivity checks, run the calculation at your base case cap rate and then at 1.5 points higher. If the investment still pencils at the higher cap rate, you have a margin of safety.
On a $400,000 value uplift, that is $24,000–$32,000 in friction. Factor it in when comparing amenity investment to other capital uses.
Typical costs, operating budgets, and payback timelines by amenity type
Cost ranges below reflect US market conditions. Actual quotes will vary by market, property size, and vendor.
Connectivity / infrastructure (fiber, property-wide WiFi):
- Upfront: $150,000–$600,000 depending on property size and existing infrastructure
- Annual OPEX: $12,000–$40,000 (ISP wholesale, maintenance)
- Payback: 1–3 years when structured as a resident revenue service
- Notes: Highest CoC potential of any amenity category when adoption exceeds 70%
Package locker systems:
- Upfront: $20,000–$80,000 depending on unit count and configuration (indoor, outdoor, refrigerated)
- Annual OPEX: $1,800–$4,800 (software, maintenance)
- Payback: 2–4 years with resident fees; faster when staff savings are included
- Notes: Scales well; outdoor and weatherproof units add cost but expand coverage
Fitness centers:
- Upfront: $30,000–$150,000 (equipment, buildout)
- Annual OPEX: $8,000–$20,000 (equipment service, cleaning)
- Payback: 4–8 years via rent premium; rarely generates direct fee revenue unless managed as a paid membership
Pools:
- Upfront: $80,000–$350,000+
- Payback: 7–15 years; negative NPV on properties under 100 units at typical rent premiums
Co-working / business lounges:
- Upfront: $15,000–$60,000
- Annual OPEX: $3,000–$10,000
- Payback: 3–7 years; stronger returns when bookable at an hourly or daily rate
Pet amenities (dog runs, wash stations):
- Upfront: $8,000–$35,000
- Annual OPEX: $1,500–$5,000
- Payback: 2–5 years; pet fees and pet rent are direct revenue lines that often exceed the amenity cost quickly
Financing options affect CoC significantly. Leasing or financing through a vendor program can reduce upfront equity to near zero, making CoC calculations look very strong in early years while extending total cost. Always model the all-in cost over the hold period, not just the monthly payment.
Installation and measurement timeline (numbered):
- Months 1–2: Vendor selection, contract negotiation, permit applications
- Month 3: Installation and staff training
- Months 4–6: Soft launch, resident onboarding, adoption tracking
- Months 7–12: Full revenue run rate; collect baseline comparison data
- Months 13–24: First full year of post-install data; calculate actual vs. projected CoC
- Month 24+: Reassess OPEX, adjust pricing, and update exit value model
A practical checklist for deciding whether to greenlight an amenity investment
Work through these questions before committing capital. A “no” on any red-flag item should pause the project.
Market demand:
- [ ] Does your resident survey or lease-up data show demand for this amenity?
- [ ] Do comparable properties with this amenity command a measurable rent premium in your submarket?
- [ ] Is the submarket demographic aligned with the amenity (e.g., pet amenities in a pet-heavy market)?
Financial thresholds:
- [ ] Does the investment produce a positive NPV at a conservative (30–50%) adoption rate?
- [ ] Is the CoC at base-case assumptions above your portfolio hurdle rate?
- [ ] Does the payback period fit within your planned hold period?
Operational feasibility:
- [ ] Is incremental OPEX fully budgeted, including insurance and liability?
- [ ] Does your management team have the capacity to operate the amenity without adding headcount?
- [ ] Are there regulatory or permitting constraints (pool safety codes, ADA compliance) that add cost or delay?
Resale assumptions:
- [ ] Have you modeled value uplift at a cap rate 1.5 points above your base case?
- [ ] Does the amenity add value a buyer will underwrite, or is it a cost center at exit?
Red flags that should stop a project:
- Negative NPV even at base-case adoption
- OPEX that grows faster than the revenue the amenity generates
- Amenity requires dedicated staff the property cannot absorb
- Unit count too low to spread fixed costs (see the 60-unit pool example above)
Developers who focus only on upfront cost and ignore lease-up velocity and concession cycles consistently underperform those who underwrite the full hold period.
Pro Tip: Pilot revenue-generating amenities on one building before rolling out across a portfolio. A 90-day pilot with opt-in pricing tells you actual willingness to pay, which is almost always more accurate than a survey.
A spreadsheet-ready model you can paste into Excel or Google Sheets
Set up one tab per scenario (base, downside, upside). Label these fields in column A and enter your values in column B.
| Field Label | Formula / Input |
|---|---|
| Total units | Manual input |
| Baseline effective rent/unit/month | Manual input |
| Captured rent premium/unit/month | Manual input (use 50–70% of market premium) |
| Units capturing premium | Total units × capture rate |
| Annual rent premium revenue | Units capturing premium × premium × 12 |
| Occupancy lift (%) | Manual input (e.g., 2%) |
| Annual occupancy revenue | Total units × occupancy lift × baseline rent × 12 |
| Turnover cost/unit | Manual input (industry range varies) |
| Annual turnover savings | Total units × renewal rate improvement × turnover cost |
| Ancillary fee/unit/month | Manual input |
| Annual ancillary revenue | Units paying fee × fee × 12 |
| Total annual gross benefit | Sum of all revenue and savings lines |
| Annual incremental OPEX | Manual input |
| Annual net NOI uplift | Gross benefit – OPEX |
| Total capital cost | Manual input |
| Annual debt service (if financed) | Use PMT formula: =PMT(rate/12,term_months,–principal)×12 |
| Annual pre-tax cash flow | Net NOI uplift – annual debt service |
| Equity invested | Capital cost – loan amount |
| Simple ROI | Net NOI uplift ÷ capital cost |
| Cash-on-cash return | Annual pre-tax cash flow ÷ equity invested |
| Simple payback (years) | Capital cost ÷ net NOI uplift |
| NPV (10-year hold) | =NPV(discount_rate, year1:year10) – capital cost |
| Exit value uplift | Net NOI uplift ÷ cap rate |
Scenario ranges to test:
- Base case: 60% adoption, 100% of projected rent premium, OPEX as budgeted
- Downside: 30% adoption, 50% of rent premium, OPEX 20% over budget
- Upside: 80% adoption, full rent premium, OPEX as budgeted
The amenity ROI calculator framework used across the industry uses this same input set, which means the model above is compatible with most operator templates. For maximizing returns on multifamily properties, run all three scenarios before presenting to ownership.
What asset managers actually do with amenity ROI models
The formulas are the easy part. The judgment calls are where most pro formas go wrong.
In practice, asset managers rarely approve an amenity based on a single base-case CoC. They stress-test the adoption assumption first, because that is the number most likely to be wrong. The amenity is identical; the return is not.
The shift toward amenity profit centers changes how experienced operators underwrite these decisions. When an amenity has its own revenue line, the pro forma treats it like a small business inside the property: revenue, OPEX, margin. That framing forces cleaner assumptions and makes it easier to kill a project when the margin is too thin.
Operational drag is the most underestimated cost. A bookable event space that requires a staff member to unlock, clean, and reset after each booking adds 2–3 hours of labor per event. At 94 bookings/year, that is 188–282 hours of staff time. At $18/hour, that is $3,384–$5,076/year in hidden OPEX that rarely appears in the initial pro forma.
Two practices that consistently improve outcomes:
- Structure new amenity revenue as an opt-in line item on the lease rather than bundling it into rent. Opt-in pricing reveals actual willingness to pay within 60–90 days and gives you a real adoption number to plug into the model.
- Track utilization monthly from day one. Amenities with declining utilization after the first 90 days rarely recover without a programming change. Catching the drop early lets you adjust pricing or programming before the annual OPEX commitment locks in.
The multifamily amenities checklist from Locker Solutions is a useful starting point for identifying which amenity categories are worth modeling for your specific property type.
Package lockers from Locker Solutions: a concrete ROI example
Package volume at multifamily properties has grown to the point where unmanaged delivery is a real operational cost, not just an inconvenience. Locker Solutions installs Luxer One® electronic package lockers and automated package rooms nationwide, and the ROI model is straightforward to underwrite.
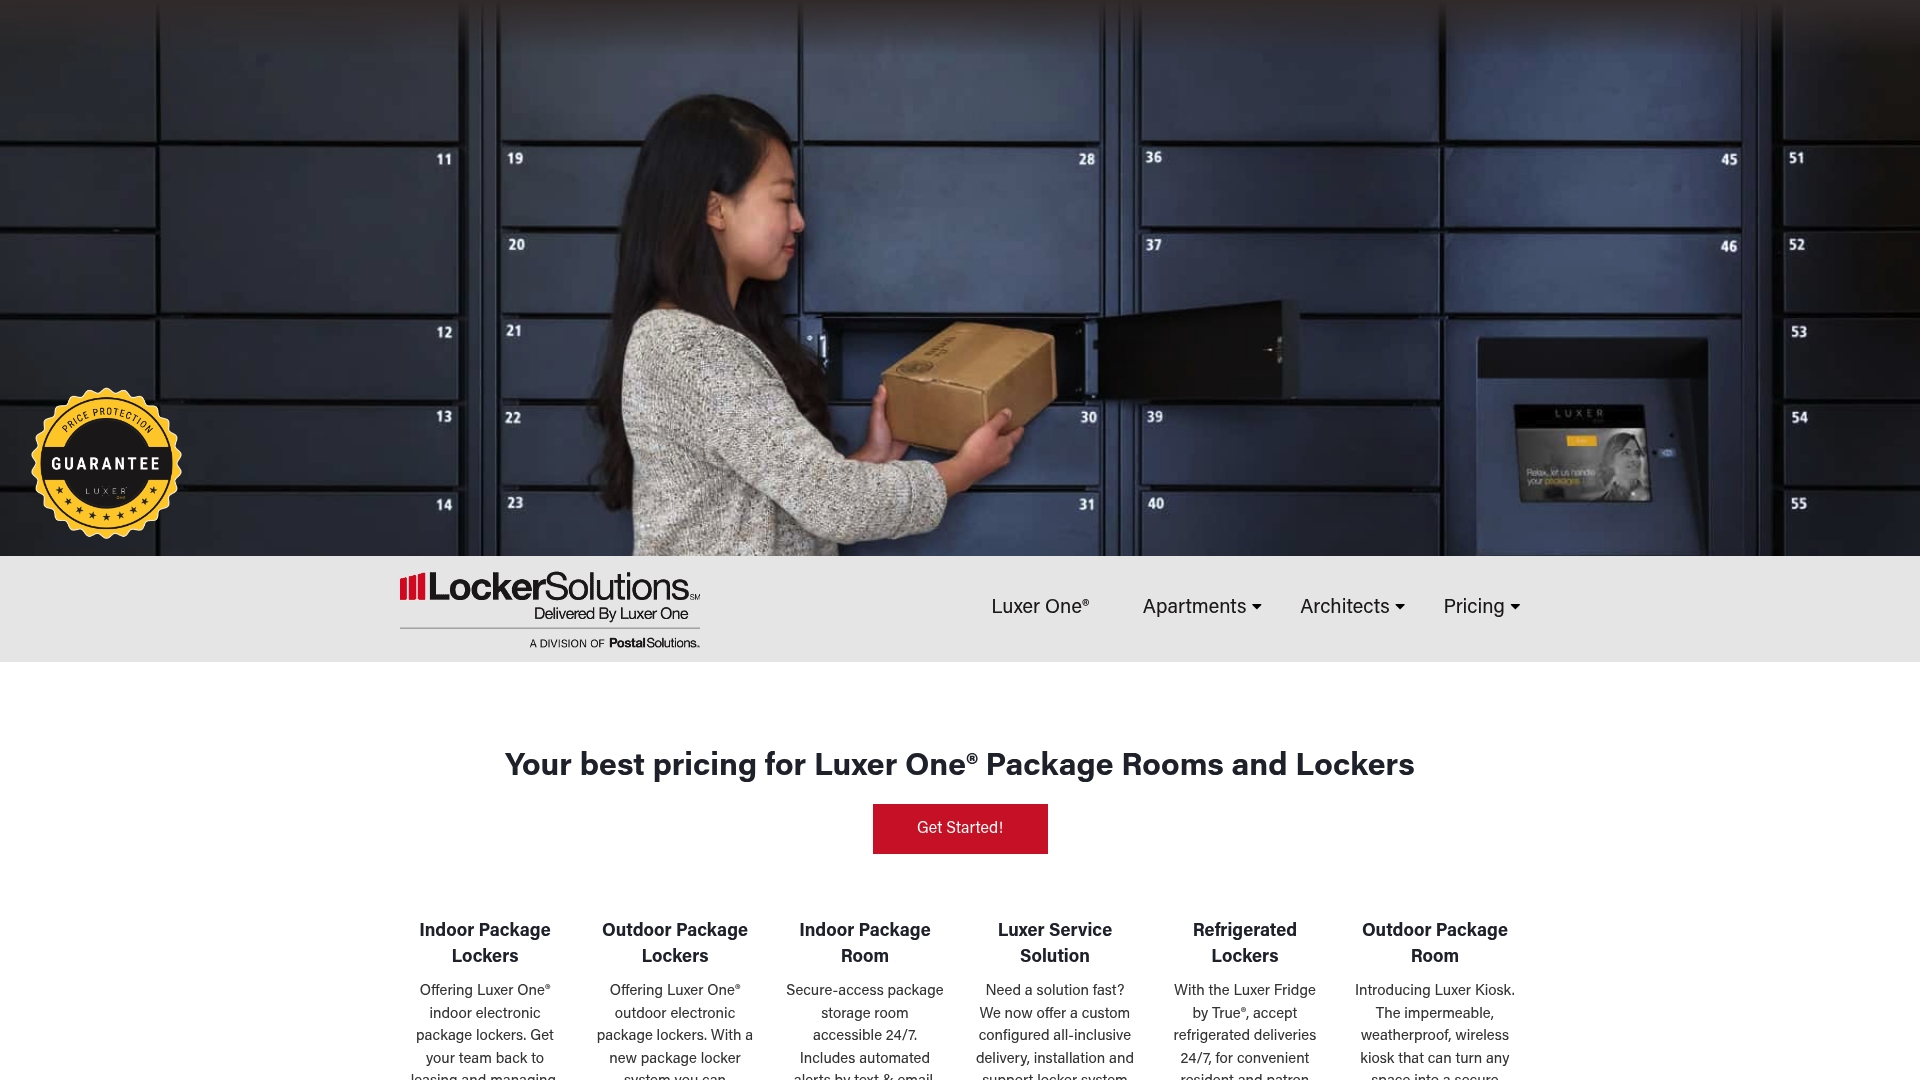
Staff time saved (estimated 1.5 hours/day at $18/hour) adds another $9,855/year. Net NOI uplift after $2,400 annual OPEX: approximately $16,455. Payback runs 2.7–4 years depending on capital cost and adoption.
Beyond the numbers, Luxer One® systems integrate with most property management software, send automated pickup alerts to residents, and include video surveillance, which reduces liability and staff involvement in package disputes. Fewer packages sitting in lobbies means fewer resident complaints and less leasing staff time spent on delivery issues.
To see configuration options and get a quote for your property, visit the Luxer One monitored package rooms page or explore the full automated package room guide to compare locker and room options by property size.
Sources
These are the primary sources behind the worked examples and formulas in this article:
- The Haven at Chisholm Trail: How One Fort Worth Property Added $2.6M at Exit Through Strategic Property-Wide WiFi Investment - Multifamily Blogs
- Class A Multifamily Amenities:
- Multifamily amenities shift to profit center models — HousingWire
- Amenity ROI: The Question Developers Get Wrong
This article is general information, not a substitute for advice from a qualified financial advisor. Consult a qualified financial professional about your own circumstances before acting on anything here.
Recommended
Ready for a Luxer One® package locker quote?
Tell us your unit count and we'll send right-sized pricing with a fast response time.
Get my free quote