June 7, 2026
Apartment ROI: Maximize Returns on Multifamily Properties
Unlock the secrets to maximizing apartment ROI! Discover strategies to boost returns on multifamily properties and make smarter investments.

Apartment ROI is the total return on investment generated by owning and operating an apartment property, measured across rental income, operating expenses, financing costs, appreciation, and tax benefits. Known formally as return on investment (ROI) in real estate finance, this metric gives investors a single framework to compare deals, stress-test assumptions, and decide where to deploy capital. A solid total ROI for rental properties typically ranges from 8% to 12% annually, with 10% to 12% considered excellent in most markets. That benchmark matters because it separates genuinely profitable acquisitions from deals that merely look attractive on paper. Whether you own a 12-unit building in Columbus or a 200-unit complex in Los Angeles, understanding how apartment ROI is built, measured, and improved is the foundation of every sound investment decision.
What are the primary apartment ROI metrics?
Apartment investment returns are not captured by a single number. Professional investors use a stack of complementary metrics, each revealing a different dimension of performance.
| Metric | What it measures | Typical target |
|---|---|---|
| Cash-on-cash return | Annual cash income divided by cash invested | 6% to 10%+ |
| Cap rate | Net Operating Income divided by property value | 5% to 8% |
| Internal Rate of Return (IRR) | Time-weighted total return over the hold period | 12% to 15% |
| Gross Rent Multiplier (GRM) | Purchase price divided by annual gross rent | Lower is better |
| Net rental yield | Net income after expenses and vacancy | 3% to 5% |
Cash-on-cash return is the most immediate gut-check for apartment cash flow. It tells you how much actual cash you pocket each year relative to the cash you put in at closing. Cash-on-cash returns under 4% often signal negative cash flow or an over-leveraged deal not worth the operational effort. That threshold is a useful filter before you spend time on deeper analysis.
Cap rate operates independently of financing, which makes it the cleanest tool for comparing properties across markets. A 6% cap rate in Phoenix and a 4.5% cap rate in Seattle reflect different risk and appreciation profiles, not just different prices. Professional investors evaluate deals using a minimum debt service coverage ratio (DSCR) of 1.25, a cash-on-cash target of 6% to 10%, and an IRR range of 12% to 15%.
IRR is where many investors underperform their own potential. Many investors obsess over monthly cash flow but undervalue IRR, which incorporates appreciation, principal paydown, and selling costs across the full hold period. A deal with modest monthly cash flow but strong appreciation and a five-year exit can dramatically outperform a high-cash-flow property in a stagnant market.
Pro Tip: Run your IRR calculation at two exit cap rates: your expected rate and one full point higher. If the deal still clears your hurdle rate under the pessimistic scenario, you have real margin of safety.
Net rental yield and GRM round out the picture. Net rental yields in global metropolitan markets range from 3% to 5% after service charges and vacancy, with gross yields running 2.0 to 3.5 percentage points higher. GRM is a fast screening tool, not a final decision metric, but it quickly eliminates overpriced listings before you invest time in full underwriting.
Which factors most significantly impact apartment ROI?
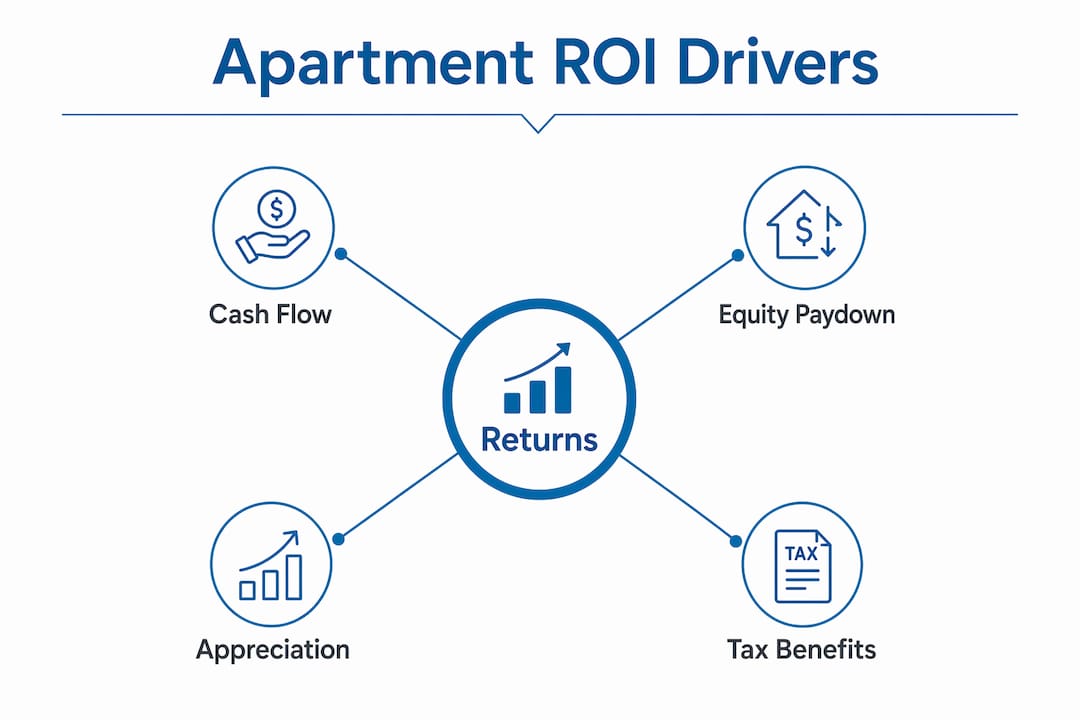
Four return streams exist for every rental property: cash flow, equity paydown, appreciation, and tax benefits. Each one is controllable to varying degrees, and ignoring any of them produces a distorted picture of actual performance.
Expenses are the most commonly underestimated variable. The 50% rule estimates expenses at 50% of gross rent, but that figure shifts based on property age, rent level, and whether you self-manage or hire a third party. Property management fees typically run 8% to 12% of collected rent. Maintenance reserves for older buildings should be budgeted at 10% to 15% of gross income, not the 5% figure many first-time buyers use. Vacancy rates nationally are projected at 4.5% to 4.8% in 2026, but local submarkets can swing that number significantly in either direction.
Financing terms shape apartment ROI more than most investors admit. A 50-basis-point increase in your mortgage rate on a $3 million acquisition can reduce annual cash flow by $15,000 or more. A DSCR above 1.25 is critical to withstand tenant cycles and interest rate volatility. Deals that barely clear 1.0 DSCR at origination become cash traps the moment a unit sits vacant for 60 days.

Tax benefits are the hidden accelerant in rental property ROI. Depreciation and mortgage interest deductions add effective ROI of 2% to 5% depending on the investor’s tax bracket. A property generating 7% cash-on-cash return can deliver 9% to 10% after-tax ROI once depreciation is factored in. Investors who ignore this are leaving real money uncounted.
Market factors including local rent growth, absorption rates, and zoning policy determine the ceiling on your returns. Rent growth is projected at 3% to 4% nationally in 2026, but markets with constrained supply and strong job growth will outperform that average. Rent control ordinances in cities like San Francisco and New York cap your upside and must be underwritten explicitly, not assumed away.
How do investment strategies compare for apartment returns?
Not all apartment investment strategies produce the same ROI profile, and the right choice depends entirely on your capital position, risk tolerance, and hold period.
Core and stabilized assets are fully leased, well-maintained properties in established markets. They offer predictable income and low operational complexity, but their cap rates reflect that safety. Investors in this category typically target 5% to 6% cap rates and 8% to 10% total returns. These deals suit investors who prioritize capital preservation over growth.
Value-add investments are the most common strategy among active apartment investors. You acquire a property with below-market rents, deferred maintenance, or operational inefficiencies, then correct them. Midwest markets tend to offer higher cash-on-cash returns of 7% to 12% and value-add returns of 11% to 15%, while coastal markets offer lower cap rates but superior long-term appreciation. The trade-off is real: a Cleveland value-add deal might generate $400 per door per month in cash flow, while a comparable San Diego property generates $150 per door but appreciates 5% annually.
Opportunistic strategies including ground-up development and distressed acquisitions target IRRs of 18% or higher. The risk profile is proportionally elevated. Construction cost overruns, permitting delays, and lease-up risk can compress returns to single digits or below.
Pro Tip: Before committing to a value-add strategy, get contractor bids on your renovation scope before closing, not after. Investors who underwrite renovation costs from memory rather than actual bids routinely overspend by 20% to 30%.
One of the most underutilized tools for maximizing apartment returns is the accessory dwelling unit (ADU). Strategic use of ADUs generates high-margin rental income without land acquisition costs. Adding ADUs can increase total ROI by 2% to 4% through additional rental income, and yield on cost in premium markets can exceed 15%. In states like California where ADU permitting has been simplified, this is one of the highest-return capital allocation decisions available to apartment owners.
How to calculate apartment ROI for investment decisions
Calculating rental property ROI accurately requires a structured process. Skipping steps or using round numbers produces results that look clean but mislead.
- Start with acquisition cost. Include purchase price, closing costs, and any immediate capital expenditures. This is your total invested capital before financing.
- Model your financing. Input loan amount, interest rate, amortization period, and calculate your annual debt service. Confirm your DSCR clears 1.25 at your projected NOI.
- Project gross rental income. Use current in-place rents, not pro forma rents, as your baseline. Apply a realistic vacancy factor of 5% to 8% for most markets.
- Subtract all operating expenses. Include property management, maintenance reserves, insurance, property taxes, utilities, and a capital expenditure reserve. Use the 50% rule as a sanity check, then refine with actual numbers.
- Calculate NOI and cash flow. NOI equals gross income minus operating expenses. Cash flow equals NOI minus debt service. Your cash-on-cash return equals annual cash flow divided by total cash invested.
- Layer in tax benefits. Add depreciation and interest deductions to arrive at after-tax ROI. This step separates accurate underwriting from amateur analysis.
- Run your IRR. Model the full hold period including projected appreciation, principal paydown, and selling costs. Use a 5% to 7% annual appreciation assumption for most markets, and stress-test at 2% to 3%.
Stress-testing occupancy and expense assumptions guards against overly optimistic investment decisions prone to cash flow disruption. Break-even occupancy rates above 95% signal dangerous deals where a single vacancy can wipe out annual profits. Any deal where your break-even occupancy exceeds 90% deserves serious scrutiny before you proceed.
The most common calculation errors are using pro forma rents instead of current rents, ignoring capital expenditure reserves entirely, and failing to account for the true cost of self-management. Self-management is not free. Your time has a dollar value, and that value belongs in the expense column.
Pro Tip: Build your underwriting model in a spreadsheet with a dedicated sensitivity table. Change your vacancy assumption from 5% to 10% and your rent growth from 3% to 0%. If the deal still produces acceptable returns under both scenarios, you have a genuinely resilient investment.
Key takeaways
Apartment ROI is most accurately measured by combining cash-on-cash return, cap rate, IRR, and after-tax yield into a single underwriting framework rather than relying on any one metric alone.
| Point | Details |
|---|---|
| Use multiple ROI metrics | Cash-on-cash, cap rate, and IRR together reveal what any single metric hides. |
| Target DSCR above 1.25 | Deals below this threshold risk negative cash flow under normal vacancy conditions. |
| Factor in tax benefits | Depreciation and interest deductions add 2% to 5% to effective ROI depending on tax bracket. |
| Match strategy to market | Midwest markets favor cash flow; coastal markets favor appreciation. Choose based on your hold period. |
| Stress-test every deal | Model occupancy at 90% and rent growth at 0% before committing capital. |
The ROI metric most investors are still getting wrong
At Locker Solutions, we work with property managers and owners across the country, and the pattern we see most often is not bad math. It is incomplete math. Investors calculate cash flow correctly, then stop. They do not model IRR. They do not quantify tax benefits. They do not account for the operational costs that erode returns quietly over time, including staff hours spent managing package deliveries, handling resident complaints, and processing maintenance requests that stem from deferred capital investment.
In 2026, cautious recalibration favors stable income over speculative growth, making tax shields and consistent NOI growth the primary drivers of apartment ROI. That shift rewards investors who run tight operations and penalizes those who rely on rent growth to bail out weak underwriting. The investors we see outperforming their peers are not finding better markets. They are running better buildings, with lower turnover, higher resident satisfaction, and fewer operational surprises.
The experienced investors we respect most treat the 1% rule as outdated. Current viable rent-to-price ratios fall between 0.6% and 0.8% in most U.S. markets. Chasing the 1% rule today means buying in markets with structural vacancy problems or deteriorating fundamentals. Conservative assumptions and thorough due diligence are not pessimism. They are the discipline that separates investors who build wealth from those who merely stay busy.
— Locker Solutions
How package management upgrades improve your apartment ROI
Every dollar of NOI you protect or add flows directly to your property’s value. At a 6% cap rate, $10,000 in additional annual NOI translates to $167,000 in property value. That math makes operational upgrades worth examining with the same rigor you apply to rent increases.
Locker Solutions installs Luxer One® automated package lockers and package rooms in multifamily properties nationwide. These systems reduce staff time spent managing deliveries, eliminate package theft complaints, and give residents 24/7 access to their parcels without involving your team. Lower turnover, higher resident satisfaction scores, and reduced operational friction all contribute to stronger occupancy and NOI. Explore Luxer One package room solutions to see how a single infrastructure upgrade can protect and grow your apartment investment returns. You can also review the cost and ROI breakdown for apartment package lockers before making a decision.
FAQ
What is a good apartment ROI?
A good apartment ROI ranges from 8% to 12% annually in total returns, with 10% to 12% considered excellent in most U.S. markets. Cash-on-cash return targets of 6% to 10% and cap rates of 5% to 8% are standard benchmarks for professional investors.
How do I calculate ROI on an apartment investment?
Divide your annual net cash flow by your total cash invested to get cash-on-cash return, then layer in appreciation, principal paydown, and tax benefits to calculate total ROI. Running an IRR model over your full hold period gives the most accurate picture of apartment investment returns.
What is the minimum DSCR for an apartment investment?
A debt service coverage ratio of 1.25 or higher is the standard minimum for apartment investments. Deals with a DSCR below 1.25 risk negative cash flow under normal vacancy and expense conditions.
How do value-add strategies affect apartment ROI?
Value-add renovations and ADU additions can increase total ROI by 2% to 4% through higher rents and additional income streams. Midwest value-add deals typically target cash-on-cash returns of 7% to 12% and total returns of 11% to 15%.
What expenses are most commonly underestimated in apartment ROI calculations?
Maintenance reserves, capital expenditure budgets, and property management fees are the most frequently underestimated costs. Using the 50% rule as a baseline expense estimate, then refining with actual property data, reduces the risk of overstating projected cash flow.
Recommended
- Apartment package lockers: cost, ROI, and what drives the price — Locker Solutions Blog
- Blog — Luxer One® Package Locker Insights for Multifamily
- Parcel lockers for apartments: complete guide for property managers — Locker Solutions Blog
- Smart package lockers for apartments: the 2026 buyer’s guide — Locker Solutions Blog
Ready for a Luxer One® package locker quote?
Tell us your unit count and we'll send right-sized pricing with a fast response time.
Get my free quote