September 20, 2026
7 Package Locker KPIs Property Managers Need to Cut Overflow
KPI playbook for property managers: seven locker metrics, reporting cadence, seasonal targets, and a checklist to cut overflow and labor.

Track throughput, utilization, dwell time, overflow, loss/theft rate, notification success, and staff-hours-saved. Those seven package locker KPIs together tell you whether a locker system is actually working, not just installed. Miss any one of them and you’re optimizing blind, whether the goal is faster resident pickups, lower labor costs, or a smarter decision about your next capacity upgrade.
TL;DR:
- Keeping locker utilization near 60 percent outside peak periods helps prevent overflow and rejects, ensuring efficient capacity management.
- Monitoring dwell time, especially the median, identifies slow pickups that can restrict capacity without hardware expansion.
- Addressing high overflow rates often involves adjusting notification timing and coordinating carrier delivery routes before adding lockers.
- Using consistent, automated data collection from package intake, pickup, and incident reports enables accurate KPI tracking and informed decision making.
- Measuring first, then investing in lockers reveals configuration issues early, reducing unnecessary hardware costs and resident complaints.
Table of Contents
- What Are the Most Important Package Locker KPIs?
- How Do You Calculate Locker KPIs?
- What Are Good Benchmark Targets for Locker Utilization?
- What Should You Do When a Locker KPI Goes Off Target?
- A Practical Checklist for Tracking These KPIs
- Why KPI Discipline Beats Guessing at Locker Capacity
- How Locker Solutions Helps You Act on These Numbers
- Sources
- FAQ
What Are the Most Important Package Locker KPIs?
Each of these metrics answers a different operational question. Skip one, and you’re guessing at half the picture.
Throughput (package volume) counts how many packages move through the system per day or week. Averages hide the real story, since a property that handles 40 packages on a typical Tuesday might see 150 during a December surge. Track both average and peak volume separately.
Locker utilization or occupancy rate measures the percentage of cells in use at any given moment. Low utilization suggests oversized hardware and wasted capital.
Parcel dwell time, also called average pickup time, tracks how long a package sits in a cell before a resident retrieves it. Longer dwell times eat into available capacity even when package volume stays flat, since a slow-moving cell can’t accept a new delivery until it’s cleared.
Overflow or excess/rejected deliveries count packages a carrier couldn’t place because no locker was free. This metric is arguably the one residents feel most directly. Every rejected delivery either lands in an unsecured lobby pile or gets sent back to a distribution center.
Beyond those four core measures, a full KPI framework tracked by locker analytics specialists also includes:
- Package processing time: how long staff or automated intake takes from carrier drop-off to a package being logged and stored.
- Loss/theft rate: incidents per package volume, typically normalized per 10,000 deliveries.
- Notification delivery success: the percentage of pickup alerts that actually reach residents via text, app, or email.
- Adoption rate: what share of residents actively use the locker system versus relying on staff-assisted pickup.
- Cost per transaction: total operating cost divided by packages processed, a number that matters when justifying budget.
- Staff-hours saved: the labor time recovered by shifting from manual sign-in logs to self-service retrieval.
How Do You Calculate Locker KPIs?
Most of these numbers come from data you’re likely already generating. The trick is capturing it consistently and reviewing it on a schedule that matches how fast the number can change.
Start with the core formulas:
- Occupancy rate = (cells currently occupied ÷ total cells) × 100, sampled at multiple points during the day rather than once.
- Average pickup time = total dwell time across all packages ÷ number of packages picked up, over the reporting period.
- Throughput = total packages logged ÷ number of days in the period, reported alongside the single busiest day.
- Overflow rate = rejected deliveries ÷ total delivery attempts, expressed as a percentage or a raw weekly count.
- Loss/theft rate = confirmed incidents ÷ (total packages ÷ 10,000), which normalizes the number so a 500-unit property and a 50-unit property can be compared fairly.
You need a handful of data fields to run these calculations: package intake and pickup timestamps, locker ID and cell size, resident ID, notification send and confirmation logs, incident reports, and staff time entries. Vendor reporting tools often expose these as structured report columns by building, route, and activity period, which saves you from building a tracking spreadsheet from scratch.
Pro Tip: *Use median pickup time, not mean, for your primary dwell-time metric.
Review throughput and overflow daily on an operations dashboard, utilization and dwell time weekly for trend direction, and cost-per-transaction and adoption rate monthly for capacity planning. Watch for single-day spikes around holidays. Amazon’s own capacity research found that predictive, ML-based scheduling raised locker throughput by an average of 6% and up to 23% compared to a simple first-come-first-served allocation, proof that smarter allocation logic, not just bigger hardware, moves the numbers.
What Are Good Benchmark Targets for Locker Utilization?
Simulation research on residential parcel lockers points to a useful rule of thumb: keep average occupancy near 60% outside of peak periods, with overflow capped around five excess packages per week as a practical acceptance threshold. Those aren’t universal laws, but they’re a sane starting point for sizing decisions.
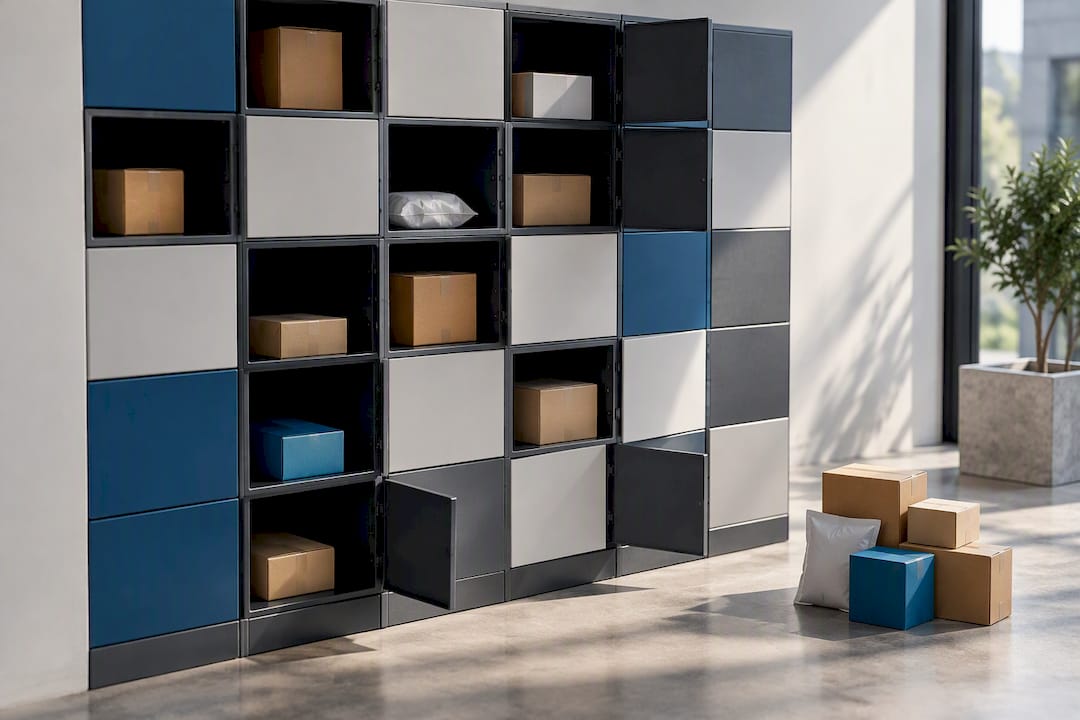
Set your own property-specific target with a simple sensitivity check: run your average and peak package volumes against different cell counts and cell-size mixes, and see where overflow starts climbing sharply. That inflection point, not a generic industry number, should define your cap.
Seasonal variation is not optional to plan for. A few practical adjustments:
- Build a rolling 90-day baseline instead of comparing this week to last week.
- Set a separate holiday-season threshold rather than triggering alarms every November.
- Reassess targets after any change in resident count or major renovation, not on a fixed annual schedule.
What Should You Do When a Locker KPI Goes Off Target?
A KPI moving in the wrong direction should trigger a specific response, not a generic “keep an eye on it.”
- High occupancy: shift notification timing to nudge faster pickups, or open a temporary satellite pickup window during peak weeks.
- Rising dwell time: audit whether notifications are actually reaching residents before assuming behavior is the problem.
- Climbing overflow: check delivery timing against high-frequency carrier routes before assuming you need more cells.
- Notification failures: verify contact data accuracy first; a stale phone number causes more missed pickups than app bugs do.
- Security incidents: review access logs and camera coverage immediately, and treat any spike as urgent, not seasonal noise.
Resist the urge to react to a single bad day. And don’t fall for the vanity-metric trap: industry commentary rightly warns that counting locker units alone tells you almost nothing about whether the system is serving residents well.
Pro Tip: *Before requesting more lockers, try adjusting notification cadence and coordinating pickup windows with your highest-volume carrier for two weeks.
A Practical Checklist for Tracking These KPIs
Getting reliable numbers depends on the data pipeline behind them as much as the metrics themselves. A workable rollout looks like this:
- Connect your property management system, carrier delivery feeds, and locker telemetry so timestamps sync automatically instead of requiring manual entry.
- Capture the required fields from day one: package IDs, cell assignments, resident IDs, notification logs, and incident reports.
- Assign clear ownership, typically the on-site property manager for daily monitoring and an ops lead or vendor partner for the monthly capacity review.
- Map vendor features to KPI outcomes: automated alerts improve notification success and dwell time, unified access control reduces theft and security incidents, and video coverage supports faster incident resolution.
- Revisit your locker ROI math once a full quarter of data exists, using it to justify future capacity or hardware investment.
Why KPI Discipline Beats Guessing at Locker Capacity
The properties that get this right don’t add lockers first and measure later. They measure first, then invest. Watching dwell time and overflow for a few weeks before ordering more hardware routinely reveals a configuration problem, not a capacity one. Small operational tests, adjusted notification timing, a temporary pickup window, cost nothing and often fix what looks like a hardware shortage. Get the metrics right, and lobby overflow drops, staff time frees up, and residents stop complaining about “locker full” messages.
— Locker Solutions
How Locker Solutions Helps You Act on These Numbers
Once you know which package locker KPIs are slipping, the harder part is fixing the underlying system without a six-month capital project. Locker Solutions installs indoor and outdoor Luxer One® lockers, refrigerated units, and automated package rooms sized to your actual occupancy and overflow data, not a generic unit count.
For properties where staff-hours-saved and loss/theft numbers are the priority, on-site package management shifts daily intake, tracking, and resident notifications to a dedicated team, freeing your leasing staff from sign-in logs entirely. Pair that with unified access control to close the security gap between package areas and building entry, one credential system instead of two. Installations can include telemetry to track utilization, dwell time, and notification success from early deployment. Request a demo or a sample KPI dashboard through the Locker Solutions product overview to see what your property’s numbers could look like in 60 to 90 days.
Sources
- Amazon Locker capacity management (arXiv)
- What is the Right Size for a Residential Building Parcel Locker? (SAGE Journals)
- The key to your lockers — Post & Parcel
FAQ
What Are the Top KPIs for Package Lockers?
The essential five are throughput, utilization rate, dwell time, overflow rate, and loss/theft rate. Notification success and staff-hours-saved round out a complete package locker KPI set for most multifamily properties.
What Are the Main KPIs for Warehousing and Shipping Operations That Apply to Lockers?
Warehousing and shipping KPIs like throughput, dwell time, and processing time translate directly to locker systems since both track how fast a package moves from intake to hand-off. The biggest difference is that locker KPIs also weigh resident-facing factors like notification success and adoption rate.
What Is a Good Occupancy Rate for a Package Locker System?
Simulation research suggests capping average occupancy near 60% outside peak season, since higher sustained rates tend to push overflow and rejected deliveries upward, per SAGE Journals research. Your specific cap should still reflect your property’s delivery volume and cell-size mix.
How Do You Reduce Package Overflow at Apartment Lockers?
Overflow drops fastest when you fix cell-size mix and pickup timing before adding hardware. Adjusting notification cadence and coordinating with high-frequency carriers often resolves overflow issues that look like a capacity shortage.
Does Locker Solutions Provide Data on KPI Performance?
Locker Solutions installations include telemetry that tracks utilization, dwell time, and notification success from the start of deployment. Current pricing and system specifications are available through the Locker Solutions product pages.
Recommended
Ready for a Luxer One® package locker quote?
Tell us your unit count and we'll send right-sized pricing with a fast response time.
Get my free quote